The User Interface
Controls

Buttons:
- Top Left (info button) - Click to access link to github page where you can see documentation, report an issue, or submit a feature request.
- Top Right (desktop button) - Click to digitize data directly from your desktop screen
- Bottom Left (settings button) - Customize some setting such as the color of the cross hairs, the color and shape of the points, and toggle the magnifying glass effect.
- Bottom Right (images button) - Click to import one or more images to be digitized.
Image Bar

The image bar shows what images have been imported. When an image is clicked on, the application will switch to that project. To remove the project, click on the x button.
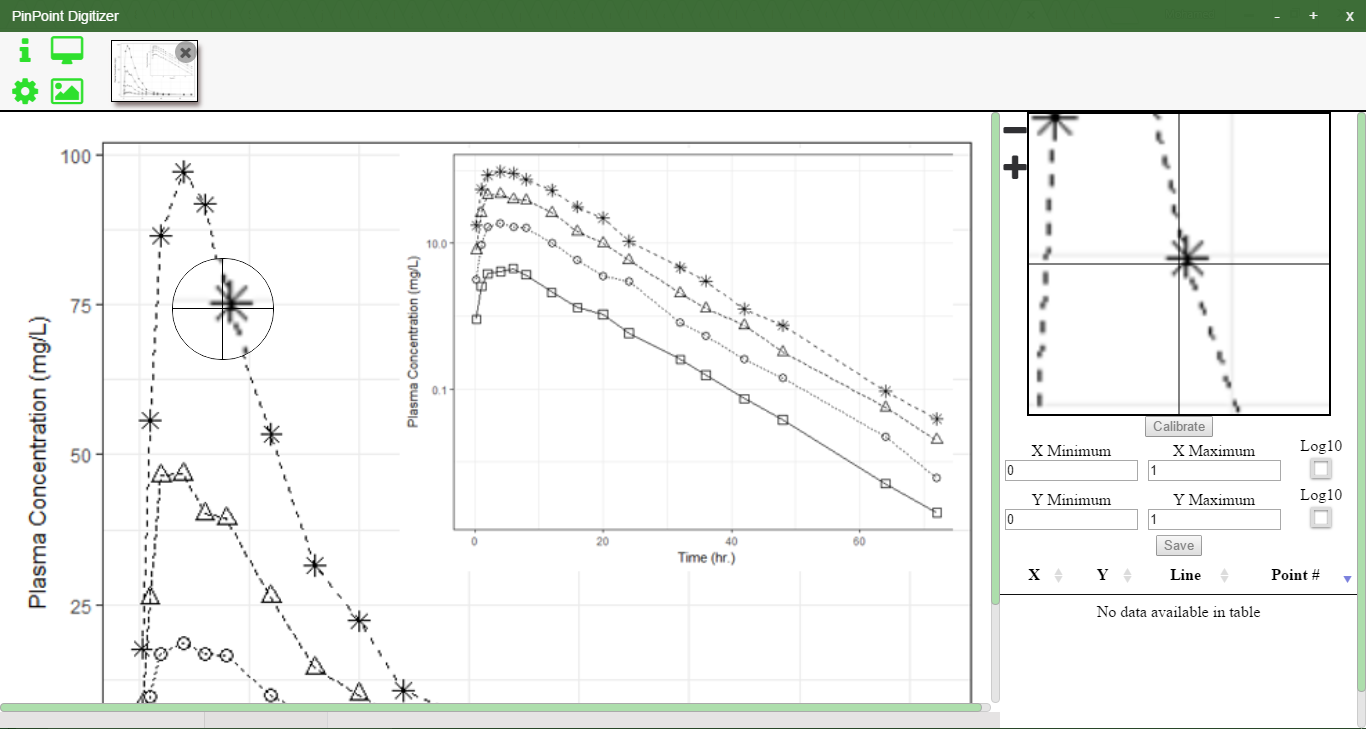
Plot Canvas Area
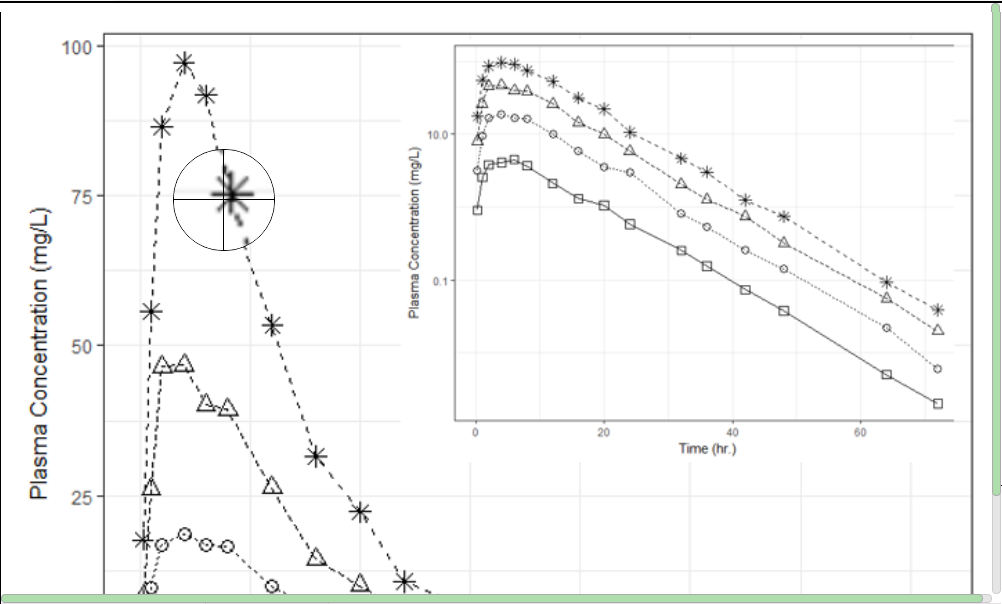
The plot canvas area is where you can interact with the plot. After calibrating click on the points to capture them and adjust them using the keyboard. The magnifying glass effect shows a zoomed image where the pointer is for high accuracy of clicking.
Mini Canvas
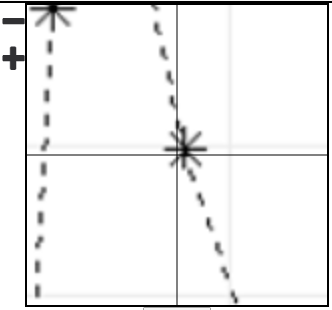
The mini canvas area shows a zoomed effect on the image. The plus (+) and minus (-) buttons can be used to increase and decrease the size of the image being captured.
Calibration
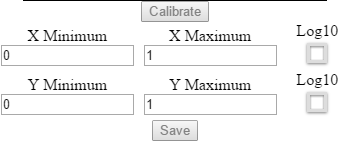
The calibration area has input fields to provide the calibration points of the image. When calibrating, the first clicked point is X-minimum, the second is X-maximum, the third is Y-minimum, and the fourth is Y-maximum. Clicking the Log10 check boxes will indicate the plot has a log 10 scaled axis.
Table
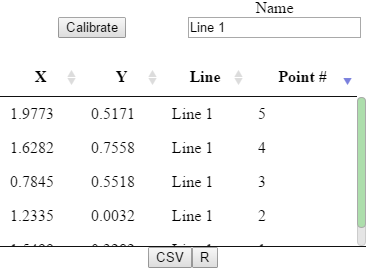
The table area shows a table of the captured points. Points will be labeled by the input of the "Name" field when they are captured. Data can be exported directly to a csv file, or by clicking the "R" button, data will be copied to the clipboard in an R data.frame format.